Hands-On, Minds-On Meteorology
Description | Programming | Operation

Contour (including Contour (Temperature) and Contour (Pressure))

Description

The Contour program allows students to interactively contour maps and compare their analysis to a provided solution. The application provides opportunity for multiple exercises. In this program, students can contour both temperature and pressure. Contour (Temperature) allows only contouring of temperature, while Contour (Pressure) allows only contouring of Pressure.


click image for whole shot


Objectives

The objective of this tool is to have students look at an actual weather map and learn to contour it. This includes parsing out the correct information for the station model. They can then compare their effort to a provided solution. Contouring rules should be provided by the instructor.


Programming

Theory

The chief piece of programming theory is the way the contour lines are drawn. The x-y coordinates of the mouse during drawing are are stored in Vectors (dynamically expanding arrays). Separate vectors keep an index of start and finish points as well as the color drawn.

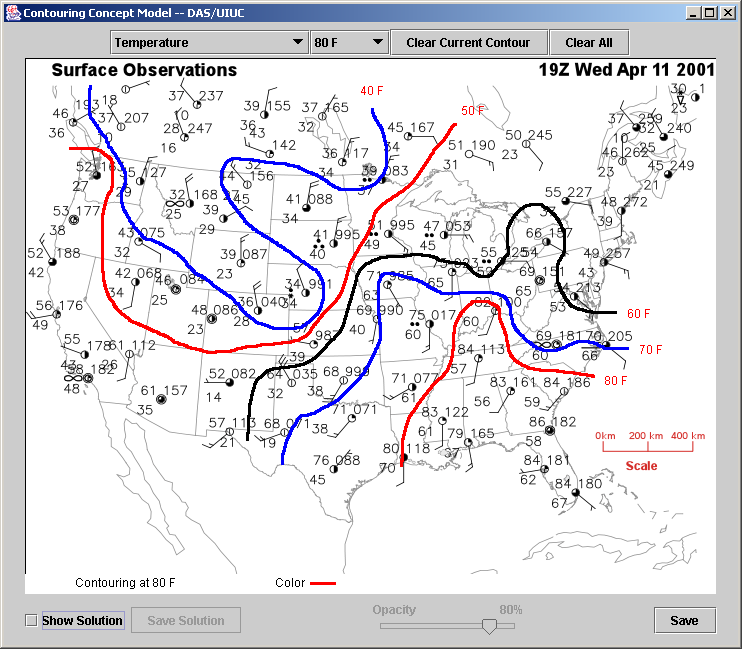
Contour labels are drawn at the beginning of each attempted stroke. They are placed smartly to avoid the contour drawing over the label. The label is placed a certain distance and direction from the beginning of each contour line. The angle is determined to be opposite of the angle between the first and fifth points of the contour line, and the distance is roughly 10-20 pixels in that direction.

Assumptions

Contouring of Temperature is hard-coded from 0°F - 90°F with an interval of 10°F.
Contouring of Pressure is hard-coded from 988mb - 1040mb with an interval of 4mb.

Equations

N/A

Other

The vector technology/philosophy can be found in the RadSat and SlideViewer applications.


Operation

Running the Program

  • Click the link for Contour, Contour (Temperature), or Contour (Pressure).
  • Change the variable to contour by changing the appropriate pulldown menu.
  • Change contour level changing appropriate pulldown menu.
  • Draw contours by clicking and holding the mouse button down while moving the mouse.
  • Contours can be removed by selecting the appropriate contour value and clicking the "Clear Current Contour" button. Note that this will remove all contours of that value that have been drawn on the map.
  • Save current side + annotations by clicking save.
  • View solution by clicking the 'show solution' checkbox.
  • Change opacity of solution to reveal student annotation.
  • Changing slides will NOT result in the loss of annotations.
  • Students can not annotate when the solution is visible (checkbox is checked)
  • Each time the mouse is clicked a contour label is placed at the start of the contour line.

Extra Knowledge

Students can not draw or save the contouring window when the solution is shown (even at 0% opacity). When asked to save their image, they will be prompted to type in a name so their picture can be distinguished from others.


Department of Atmospheric Sciences
University of Illinois at Urbana Champaign

Created by Dan Bramer: Last Modified 07/27/2004
send questions/comments to bramer@atmos.uiuc.edu