|
Agricultural Weather Weblinks
Eric Snodgrass Dept. of Atmospheric Sciences University of Illinois Urbana-Champaign |
|
Latest US/Cornbelt Ag Forecast - from Monday Nov 19, 2018 - Click Here!
(New video posted every Monday and Thursday morning. Refresh this page if it doesn't update automatically)
Current
Weather
Current
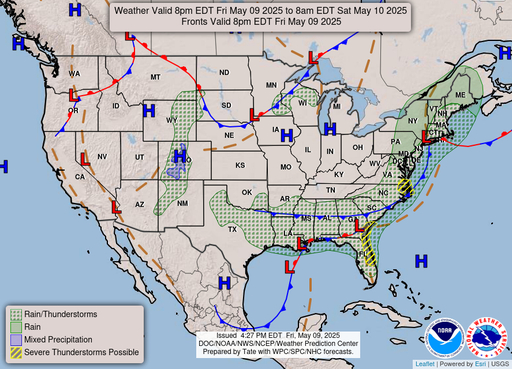
WSR88-D Radar (Loop) NOAA Current Surface
Map NWS Current Hazzards Map Current Surface Temperatures


DewPoint Temperature | Relative Humidity | Apparent Temperature | Surface Winds | earth.nullschool.net | NOWData (historical Data)
Rap SFC Obs | COD Sat/Radar | Precip | WxTap | ISWS | 24-hr dT | WxSpark | hint.fm/wind | IL Climate | WxCaster (Earl's page) | SPC Upper Air | Isentropic Maps
Wx Chan. SFC | NOAA Daily Fcst | RUC Pres. Tend | RUC SFC Td | Wyoming Soundings | CU Meteogram | CPC Hazards Outlook
US Radar (Click to Animate)
Recent Precipitation
Last 24 hours of Radar Data Loop (click for loop) | Last 7-days of global precipitation (click for loop)


Recent Climatological Data (Global)
Asian Monsoons | Asian Gridded Precip | American Monsoons | Global Monsoons | Global Precip Time Series | Reanalysis Composite Mapping
South Brazil Basins | Brazil Links | Indian Monsoon | CPC Main Page


Current Satellite Imagery
GOES 16 COD | GOES 16 Loop of the Day
GOES 16 (GOES-East) Visible Loop
GOES 16 (GOES-East) Image Viewer
Water Vapor Loops (East, West) | North Pacific Loop | North Atlantic Loop
Satellite Derived Vegetation Health Images | Landsat Vis/Order Tool | MODIS Near Real-Time | GOES Full Disk
Forecast
Best Websites for generating forecasts from the HRRR, NAM and GFS (until I finish my own graphics...)
Tropical Tidbits
Pivotal Weather
Next 7 days Max/Min Temperatures (NDFD)


Next 3 Days Accum. Precip (NDFD) | Next 7-Days Accum. Precip (GFS) | 24-hour Accum. Precip (GFS) | 3.5-day Forecast Radar (NAM) | 3.5-day Precip Forecast (NAM)


GFS Daily Precipitation maps (Days 1-10)


GFS 10-day Precipitation Anomaly


GFS 10-day Global Temeprature Anomaly Animation

GFS 10-day Snowfall | GFS 10-Day Temperatures | GFS 10-day Temperature Anomalies | GFS 10-day Precip Types


Click here for 4-panel plots
NAM 3.5-Day Temperatures Forecast | NAM 3.5-day Wind Forecast | NAM 3.5-Day Snow Forecast | NAM 0-1m Soil Moisture (%)


24-Hour Forecast Map 48-Hour Forecast Map 6-10 Day Temps 6-10 Day Precip 5-Day Precip Forecast


8-14 Day Temps 8-14 Day precip 1-Month Temp 1-Month Precip


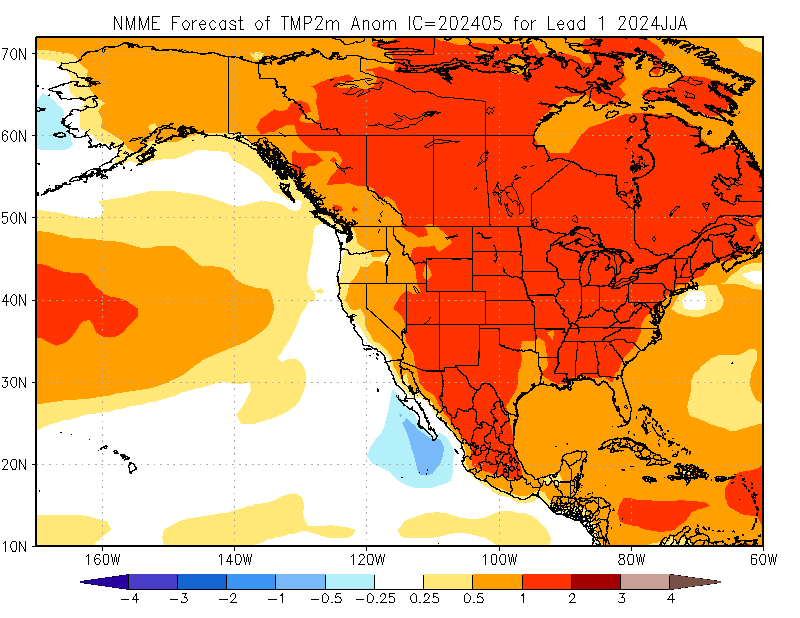
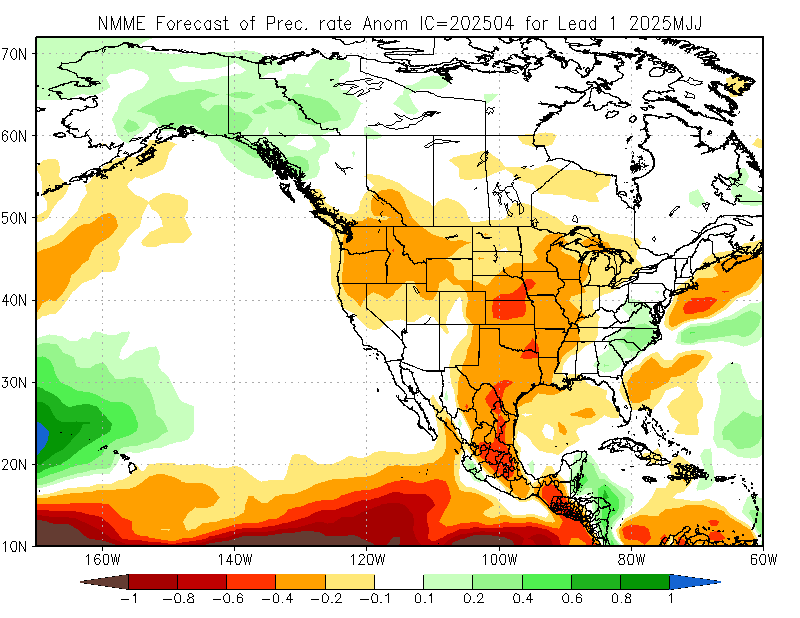
NMME 3-Month Temperature and Precipitation Forecast (Long Term Weather Links)
Agrible GFS Animations | GMOS | Tropical Tidbits | Twisterdata | National Digital Forecast | RAP | SREF | EWall | HRRR
FcstIO | HPC Snowfall Prob | Discussions | ECMWF 12Z, 0Z,30-Day CPC | 90-day | CPC 15 Month Outlook
Severe Weather
SPC Current
Activity
Lightning
Stikes
SPC
Watches
SPC Mesoscale
Discussion Excessinve Rainfall QPF

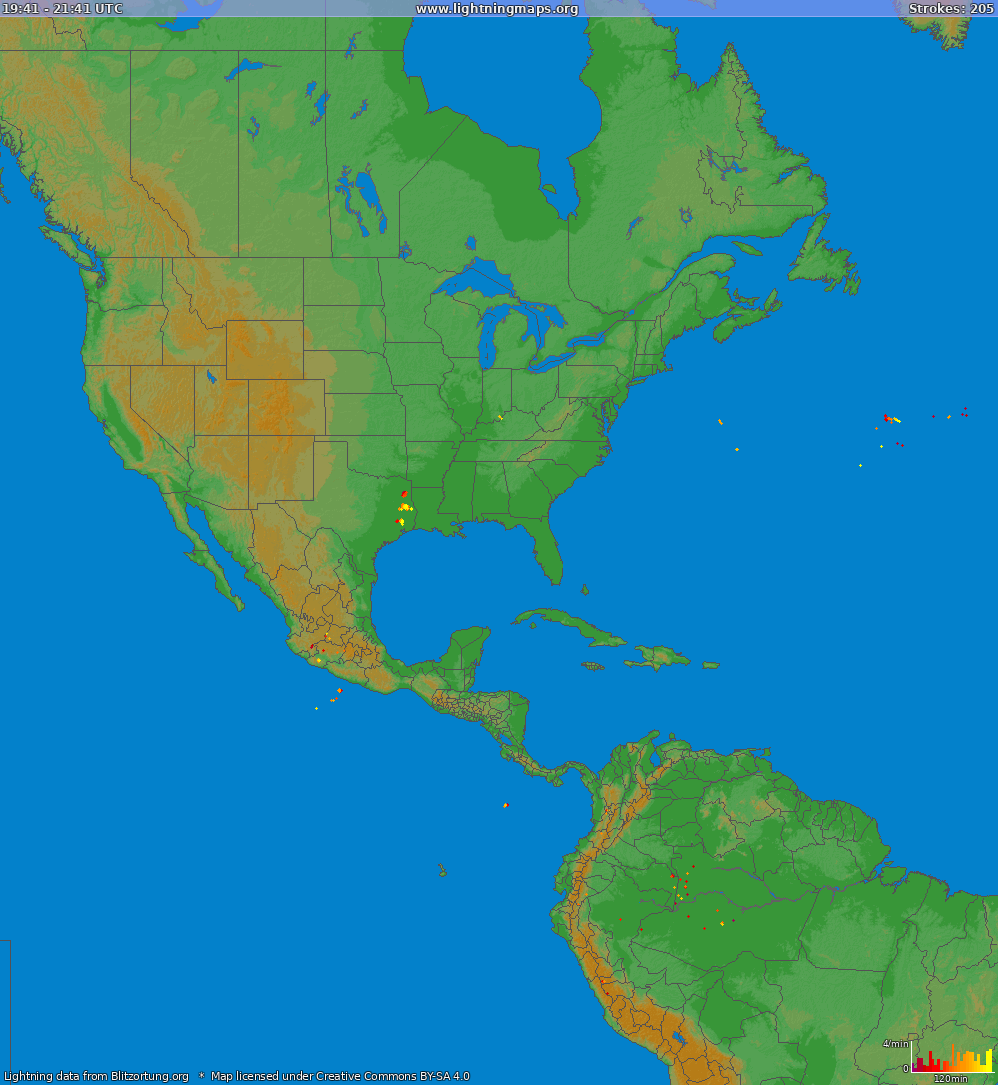

SPC Conv Outlooks | Blitzortung | Reports | Event Archive | Image Archive | SPC Tornado Stats | SPC Severe Wx Stats | Spotter Network | NWS Fatalities
Drought/Water Resources
Mountain Snow Pack Recent Temperature Anomalies Drought Indicator Crop Moisutre Soil Moisture


US Drought Info | Global Drought Monitor | Recent Precipitaiton | Western Region Climate Center | USGS River Gauge Data | Recent Anomalies
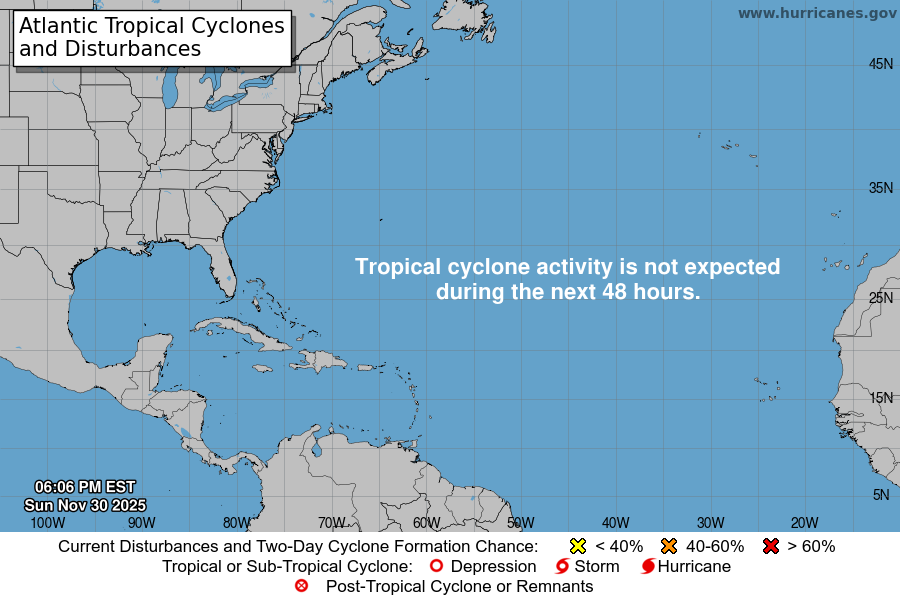
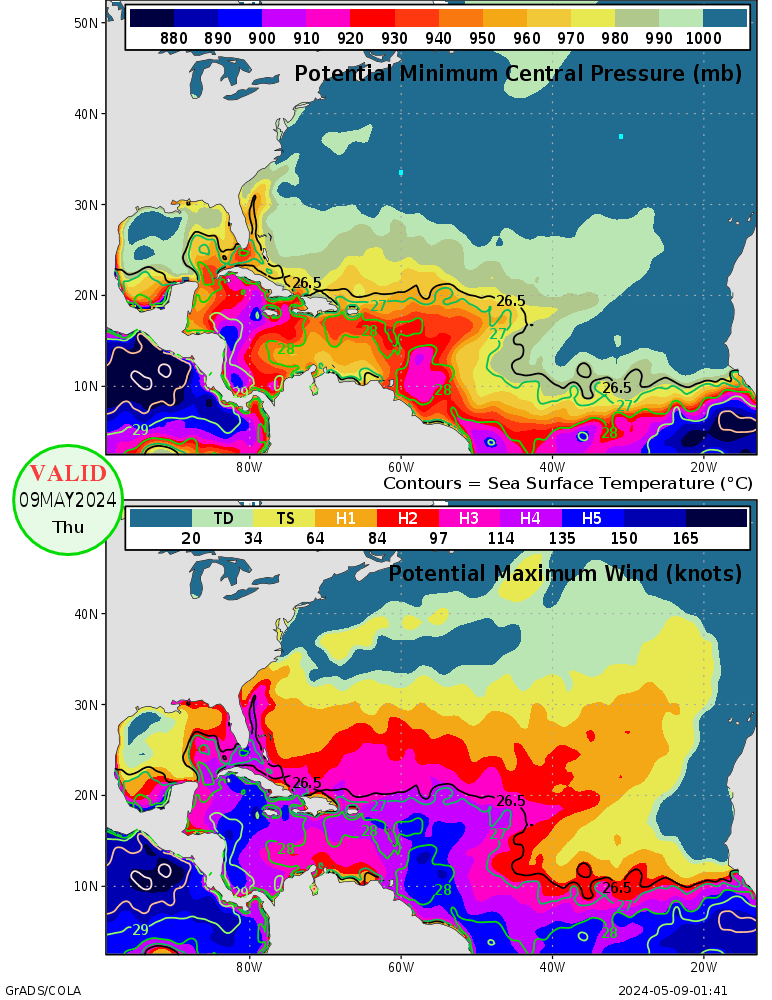
Tropical Weather
NHC Atlantic Activity 7-Day SSTs Max Intensity Atlantic Shear Tendency
Buoy Data

El Nino


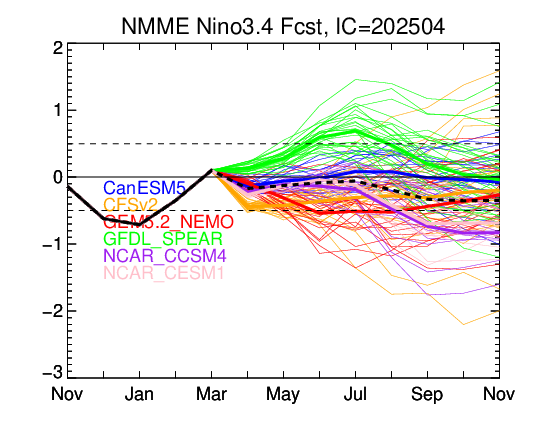
Explanation of El Nino
Pacific Decadal Oscillation (click here for the latest)

Explanation of PDO (see the "Impacts" section of this article)
Arctic Oscillation | North Atlantic Oscillation | Pacific North American Pattern


AO Explanation | NAO Explanation | PNA Explanation | Link to Original Sources
ECMWF Seasonal Correlation Maps (NAO and ENSO)
Madden-Julian Oscillaiton (MJO) Click here for CPC Main Page
Monthly Temperature and Precipitaiton Composites
MJO Explanation (original source)
QBO Historical Phase