| |
Hands-On, Minds-On Meteorology
Description
| Programming | Operation
| Pollution
Description
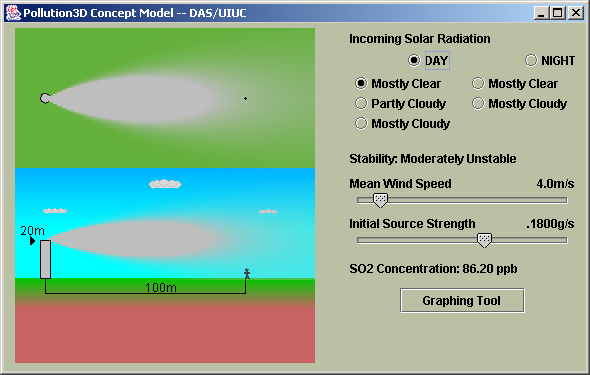
The pollution application allows the student to see how both natural
and man-made aspects of the atmosphere combine to cause pollution.
|
click for whole shot |
Objectives
The objective of this application is to show how pollution can change
given varying wind speeds, pollution source concentrations, and atmospheric
conditions.
Programming
Theory
The theory is simple. The idea is to program a simple Gaussian Plume
Model. The equation that computes Pollution concentration depends
on distance, height of source, wind speed, and stability parameters.
The last of these are computed off a table developed by Pasquill (1961)
and used repeatedly.
Assumptions
- Continuous emission of source
- downwind direction is not less than 1000m
- Pollutant is stable
- No removal of pollutant -- 100% reflection
- Gaussian distribution in crosswind and vertical
- Steady-state conditions (~1hr)
- Constant Wind Speed
- Constant wind direction with height
- Effect on wind shear on horizontal diffusion is neglected
- Dispersion parameters are independent on Z and function of x alone
- Averaging time of all quantities is the same
- Rural Area
- Pollutant is SO2
Equations
Gaussian Plume Model
Pasquill Table
|
Meteorological conditions defining Pasquill
turbulence types
|
|
Surface Wind Speed (m/s)
|
Daytime Insolation
|
Nighttime Insolation
|
|
Strong
|
Moderate
|
Slight
|
Thin Overcast
|
Cloudiness
|
|
<2
|
A
|
A-B
|
B
|
-
|
-
|
|
3
|
AB
|
B
|
C
|
E
|
F
|
|
4
|
C
|
B-C
|
C
|
D
|
E
|
|
5
|
C
|
C-D
|
D
|
D
|
D
|
|
>6
|
C
|
D
|
D
|
D
|
D
|
(More information on both of these can be found in Lyons and Scott:
Principles of Air Pollution Meteorology -- pg. 95 Fig. 3.19)
Other
Graphics:
The plume is simply a gray blob with varying transparency. For each
point in the x-y plane (top) or x-z plane (bottom), the pollution
is calculated. That point is then given a transparency value (0 =
totally invisible, 255 = totally opaque). Right now, the transparency
value equals the pollution value, and for pollution > 255, the
transparency value is set to 255.
Operation
Running the Program
- Click the 'Pollution' icon.
- Change the source volume and wind speed by sliding the appropriate
scrollbars.
- Change the Solar Radiation / Atmospheric condition by choosing
the appropriate radio button.
- Stability changes based on changes in both solar/atmospheric conditions
but also wind speed.
- Change the stack height by clicking and dragging the arrow next
to the top of the stack in the lower window. (Range: 10-40m)
- Click and drag on the guy in the lower half of the window to change
his distance from the smoke stack. (Range 25-125m)
- Enable the Graphing Tool by click
the appropriate button.
Extra Knowledge
N/A
 |
Department of Atmospheric Sciences
University of Illinois at Urbana Champaign
Created by Dan Bramer: Last Modified 07/27/2004
send questions/comments to bramer@atmos.uiuc.edu
|
|