| |
Hands-On, Minds-On Meteorology
Description
| Programming | Operation
| Jet
Stream
Description
The description, as well as the rest of this page, will be updated
one the program is finalized.
|
click for whole image |
Objectives
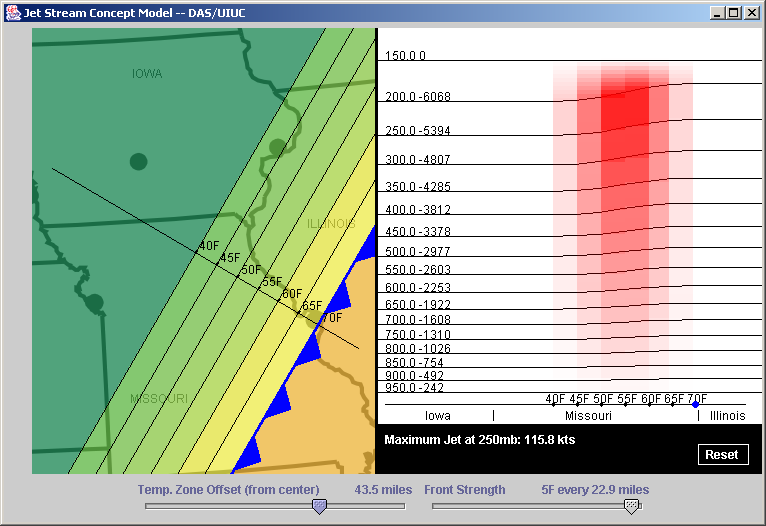
The objective of the Jet Stream program is to illustrate the relationship
between lower tropospheric temperatures and upper air winds.
Programming
Theory
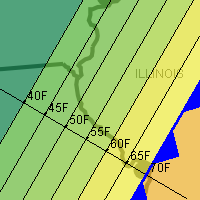
On top of a map background, isotherms are drawn parallel to each
other. On every third isotherm, 5 control points have been placed
at even intervals to allow the student to move that isotherm. The
isotherms in between the aforementioned 5 isotherms are evenly spaced
between themselves -- coming close together when control points are
moved close together, and further apart when these control points
are moved away from each other. The jet stream's strength is represented
by a transparent green film, which becomes more opaque as the wind
speed aloft increases.
Assumptions
- Jet Stream is calculated at 250mb.
- Surface Pressure is assumed to be 1000mb (even in mountains).
- There are 724,204 meters (450 miles) for every 90 pixels, or
150 miles in between default locations of the isotherms.
Equations
Other
Any other information
Operation
Running the Program
- Click the link for Jet Stream
- Click, hold the mouse over one of the control points (marked
as a brown diamond) and drag it up and down to increase or decrease
the temperature gradient.
- If the mouse is over the map, the wind speed aloft at the point
under the mouse is displayed at the bottom.
- The maximum wind speed aloft is always displayed at the bottom.
- Clicking the 'Reset' button will return the isotherms to their
original position.
Extra Knowledge
Although hard to notice at first, there are control points on the
left and right edge of the map.
 |
Department of Atmospheric Sciences
University of Illinois at Urbana Champaign
Created by Dan Bramer: Last Modified 07/27/2004
send questions/comments to bramer@atmos.uiuc.edu
|
|