| |
Hands-On, Minds-On Meteorology
Description
| Programming | Operation
| Wind
Vector Diagram
Description
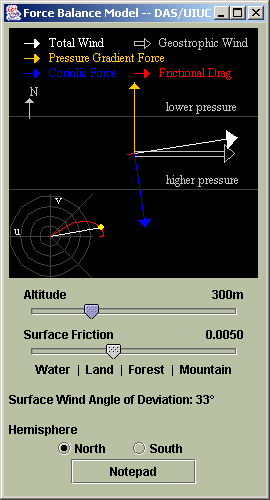
The Wind Vector Diagram program allows the user to look at how the
balance of forces change the lowest 1km of the atmosphere. Forces are
represented on a vector diagram.
|
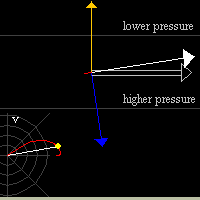
click for whole shot |
Objectives
The primary objective of the Wind Vector Diagram program to give the
student a visual interpretation of how friction influences wind direction
and speed.
Programming
Theory
No outstanding theory. When a slider is moved or a button is pressed,
functions that calculated the forces are initiated.
Assumptions
- Geostrophic wind = 25 m/s to the east.
- Surface wind = 10 m/s also to the east
- Pressure Gradient Force = constant at the value opposite the Coriolis
Force when there is no friction.
- Friction always in the direction opposite of real wind (not truly
the case -- see Bluestein: Synoptic Dynamic Meteorology in Midlatitudes
Volume 1: Principles of Kinematics and Dynamics.)
Equations
(Pressure gradient force's magnitude is constant, as is Geostrophic
wind.)
Other
N/A
Operation
Running the Program
- Click the link for Wind Vector.
- Change altitude above earth's surface with slider bar.
- Change surface friction with slider bar.
- Adjust hemisphere with the radio buttons for "Hemisphere": "north"
and "south".
- Vectors are defined on the graphic:
- orange = pressure gradient force
- blue = Coriolis force
- red = friction force
- white = Total wind (resultant wind)
- open white arrow = geostrophic wind
Extra Knowledge
N/A
 |
Department of Atmospheric Sciences
University of Illinois at Urbana Champaign
Created by Dan Bramer: Last Modified 07/27/2004
send questions/comments to bramer@atmos.uiuc.edu
|
|