| |
Hands-On, Minds-On Meteorology
Description
| Programming | Operation
| Cyclone
Description
The Cyclone application allows students to dynamically view two common
cyclone tracks and observe how weather conditions change at various
locations along the track.
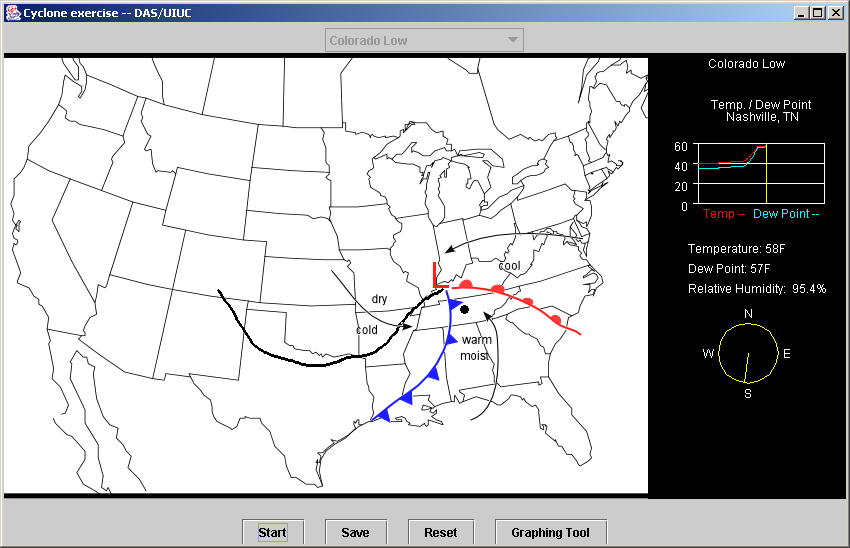
Track #1: Colorado Low
Cyclone starts in Colorado as open wave; takes typical track through
N. Texas and along the western side of the Appalachian Mts. Fronts progress
around the low with the system becoming occluded in Ohio. Data (Temperature,
Dew Point Temperature) for Nashville, TN are plotted on a meteogram
to the right of the map.
Track #2: Alberta Clipper
Cyclone starts as open wave along the British Columbia/Alberta border;
track follows US/Canadian border. Fronts progress around the low with
the system occluding near Toronto. Data (Temperature, Dew Point Temperature)
for Chicago, IL are plotted to the right of the map.
|
click for whole shot |
Objectives
The primary goal of the Cyclone program is to provide students with
a tool that lets them see a cyclone progress across the United States
and to observe how fronts migrate around the low and create various
weather changes at locations near the cyclone.
Programming
Theory
The cyclone tracks were predesignated based on common clipper and
Colorado low paths. The points that define each cyclone track are
determined by a pair of arrays (x and y pixel value). The center of
the cyclone (marked by a red 'L'), travels along that track.
Assumptions
The 'data' provided on the meteogram comes from idealized values
that would be experienced during early spring or late fall at points
along the track. A linear change in the data between these points
is assumed.
Equations
N/A
Other
N/A
Operation
Running the Program
- Click the link for Cyclone.
- Change cyclone tracks with the appropriate pulldown menu.
- Click Start to put the cyclone in motion. After (and only after)
the cyclone has run through its track once, use the mouse to drag
the cyclone along the track.
- Save the current side by clicking save.
- Once a track has been chosen and set in motion, choosing the other
track is impossible unless the reset button is clicked. The cyclone
must again run through the track before being able to again use
the mouse.
Tracks
There are two tracks that the user can choose from:
Track #1: Colorado Low
- The cyclone starts in Colorado as open wave and travels across
the United States toward the northeast. The fronts migrate around
the low pressure center with the system first occluding in Ohio.
A black line is drawn to show the path of the low pressure center.
- A black dot is located at Nashville, Tennessee. The data plotted
on the meteogram to the right of the graph illustrates the conditions
experienced in Nashville when the cyclone is at that particular
location along the track.
Track #2: Alberta Clipper
- The cyclone starts as open wave along the British Columbia/Alberta
border and tracks eastward to the northeastern United States.
Fronts migrate around the low pressure center with the system
first occluding in eastern Ontario. A black line is drawn to
show the path of the low pressure center.
- A black dot is located at Chicago, Illinois. The data plotted
on the meteogram to the right of the graph illustrates the conditions
experienced in Nashville when the cyclone is at that particular
location along the track.
Meteogram
- The red line is the city temperature.
- The cyan line is the dew point temperature.
- The yellow line shows the conditions in the city when the cyclone
is at a particular location along the track.
- Numeric values of temperature, dew point and relative humidity
are plotted below the meteogram.
- The compass shows the wind direction (direction wind is coming
from).
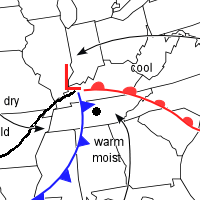
Cyclone graphics
- Each of the six figures illustrating various stages of the cyclone
includes a cold front and warm front and possibly an occluded
front (last 2 figures only).
- Thin, black arrows are drawn to denote typical wind direction.
- Relative temperatures are listed around the cyclone as "cold,"
"cool," and "warm"
- Moisture contest is listed for regions south and west of the
cyclone "moist," and "dry"
Graphing
- Graphs of temperature and dew point temperature with location
(time) along the track can be created by clicking the "Graphing
Tool."
Extra Knowledge
N/A
 |
Department of Atmospheric Sciences
University of Illinois at Urbana Champaign
Created by Dan Bramer: Last Modified 07/27/2004
send questions/comments to bramer@atmos.uiuc.edu
|
|